David Green | 13 Jul 2023


Inventory management refers to the process of overseeing and controlling a company's inventory, including the ordering, storage, tracking, and usage of materials, parts and supplies. It plays an important role in ensuring that businesses have the right quantity of inventory at the right time to meet demand while at the same time minimizing costs. Effective inventory management requires a balance between having enough stock on hand to fulfill work orders and avoiding excess inventory that ties up capital and leads to additional expenses (storage and depreciation).
Key Performance Indicators (KPIs) are quantifiable metrics used to assess the performance and progress of an organization towards its strategic goals. In the context of inventory management, KPIs provide valuable insights into various aspects of inventory performance and help businesses make informed decisions. By tracking and measuring specific KPIs, companies can evaluate their inventory efficiency, identify areas for improvement, and take proactive measures to optimize their inventory management processes.

What are Inventory Management KPIs?
Inventory Management Key Performance Indicators (KPIs) are specific metrics used to measure and evaluate the performance and effectiveness of inventory management processes within an organization. These KPIs provide quantifiable data points that reflect the efficiency, productivity, and overall health of a company's inventory operations. These KPIs help businesses gain insights into their inventory performance and make informed decisions to optimize inventory levels and reduce costs.

Role of KPIs in Measuring and Monitoring Inventory Performance
KPIs play an important role in measuring and monitoring inventory performance by providing objective and measurable indicators of key aspects of inventory management. They enable businesses to track and evaluate their progress over time, identify areas for improvement, and compare their performance against industry benchmarks and internal targets. KPIs serve as a compass, guiding businesses in making data-driven decisions to optimize inventory levels, streamline operations, and improve profitability. KPIs act as performance indicators in several important areas of inventory management, including:
1. Efficiency
KPIs such as inventory turnover ratio and order fulfillment cycle time provide insights into how effectively inventory is being managed. They help identify bottlenecks, assess the speed of inventory turnover, and optimize processes to enhance operational efficiency.
2. Maintenance Service
KPIs like stock-out rate, fill rate, and perfect order performance measure the ability to meet maintenance demands promptly and accurately. By monitoring these metrics, businesses ensure that they have the right products available when technicians need them, leading to improved productivity and reduced equipment downtime.
3. Financial Performance
KPIs such as carrying cost of inventory and gross margin return on investment (GMROI) provide financial insights into inventory management. These metrics help businesses assess the costs associated with holding inventory, evaluate profitability, and make informed decisions regarding pricing, purchasing, and product mix.
Benefits of Using KPIs in Inventory Management
Implementing and using KPIs in inventory management offer several key benefits to businesses:
1. Performance Tracking
KPIs provide a standardized and objective way to measure and track inventory performance over time. By monitoring KPIs regularly, businesses can identify trends, set benchmarks, and measure progress towards inventory-related goals.
2. Decision Making
KPIs offer valuable data-driven insights that facilitate informed decision-making. By understanding inventory performance through KPIs, businesses can make strategic adjustments to inventory levels, optimize supply chain processes, and allocate resources effectively.
3. Continuous Improvement
KPIs serve as a catalyst for continuous improvement in inventory management. By highlighting areas for improvement and identifying inefficiencies, businesses can implement initiatives to streamline processes, reduce costs, and enhance overall performance.
4. Cross-Functional Collaboration
KPIs provide a common language and framework for communication across different departments involved in inventory management and utilization. They promote collaboration, align goals, and foster a shared understanding of performance expectations, leading to enhanced coordination and synergy.
Inventory Management KPIs
1. Inventory Turnover Ratio
The inventory turnover ratio is a metric used to assess the efficiency with which a company manages its inventory. It measures the number of times inventory is used up within a specific period.
Formula
The formula for calculating the inventory turnover ratio is:
Inventory Turnover Ratio =
Cost of Inventory Utilized / Average Inventory
Where:
- Cost of Inventory Utilized represents the direct costs associated with maintenance activities, including materials, parts, and supplies consumed.
- Average Inventory is the average value of inventory over a particular time period, usually calculated by taking the beginning inventory and ending inventory values and dividing by 2.
The inventory turnover ratio is an important metric for maintenance managers as it provides insights into the efficiency and effectiveness of inventory management practices. A higher turnover ratio generally indicates more efficient utilization of inventory and better management of stock levels. On the other hand, a lower ratio may suggest excess inventory or inadequate control over stock.
Calculation Example
Let's consider an example of Company C to illustrate the calculation of the inventory turnover ratio:
Company C had a Cost of Inventory Utilized of $500,000 in a year.
The average value of inventory during the same period was $100,000.
Inventory Turnover Ratio = $500,000 / $100,000 = 5
In this example, Company C has an inventory turnover ratio of 5, indicating that its inventory was turned over five times within the year. This suggests that the company is managing its inventory efficiently and has a good balance between stock levels and maintenance requests.
It is important to note that even though the ideal inventory turnover ratio is between 5 and 10 for most industries, it can still vary across industries. Interpreting the inventory turnover ratio depends on the industry and specific maintenance requirements. Generally, a higher turnover ratio is desirable, but it needs to be balanced with the need to ensure sufficient inventory availability to avoid stockouts that can disrupt maintenance operations.
Strategies to Improve Inventory Turnover Ratio
- Demand Forecasting: Utilize historical maintenance data and trends to forecast future demand for inventory items accurately. This enables proactive inventory planning and avoids overstocking or stockouts.
- Centralized Inventory Control: Implement a centralized inventory control system like a CMMS to streamline inventory management processes. This allows for better visibility, control, and coordination of inventory across multiple maintenance locations.
- Regular Inventory Audits: Conduct periodic inventory audits to identify obsolete items. Removing excess or obsolete inventory frees up capital and reduces carrying costs.
2. Stock-Out Rate
The stock-out rate is an inventory management KPI that measures the frequency or percentage of times when a company runs out of stock for a particular item or SKU within a given period. It reflects the extent to which demand exceeds available inventory.
Formula
The formula for calculating the stock-out rate is:
Stock-Out Rate =
(Number of Stock-Out Events / Total Demand) x 100
Where:
- Number of Stock-Out Events refers to the number of instances where the company was unable to fulfill demand due to insufficient stock.
- Total Demand represents the total quantity of items demanded for maintenance during the same period.
Managing stock-outages is essential for efficiently maintaining operations and minimizing downtime. By monitoring and managing the stock-out rate, businesses can proactively address inventory shortages, optimize restocking processes, and ensure uninterrupted maintenance operations.
Calculation Example
Let's consider a Company D to illustrate the calculation of the stock-out rate:
Company D experienced 20 instances of stock-outs during a month.
The total demand for the month was 1,000 units.
Stock-Out Rate = (20 / 1,000) x 100 = 2%
In this example, Company D has a stock-out rate of 2%. This means that, on average, 2% of demand could not be met due to stock-outs. Monitoring the stock-out rate allows the company to identify trends, assess the impact of stock-outs on maintenance operations, and take appropriate measures to minimize future occurrences.
Strategies to Reduce Stock-Out Rate
Reducing the stock-out rate requires a proactive approach to inventory management. Here are some strategies to consider:
- Demand Forecasting: Implement robust demand forecasting methods to accurately predict demand and adjust inventory levels accordingly. This helps to prevent stock-outages resulting from underestimating demand.
(Use the forecasting screenshot)
- Safety Stock: Maintain a safety stock level, which is a buffer inventory kept to account for unexpected variations in demand or lead times. Safety stock helps to mitigate the risk of stock-outs caused by unforeseen circumstances.
- Using a CMMS for Inventory Visibility and Tracking: Take advantage of inventory management functionality in a CMMS that provides real-time visibility into inventory levels, allowing businesses to monitor stock levels and promptly replenish when needed. This helps to avoid stock-outs resulting from poor monitoring and control.
- Supplier Collaboration: Establish strong relationships and effective communication channels with suppliers to ensure timely deliveries and minimize lead times. Collaborating with suppliers can help reduce the risk of stock-outs caused by delayed or unreliable shipments. Better collaboration with suppliers can also reduce the need for rush or emergency orders that come at a high cost.
- Inventory Replenishment Strategies: Optimize inventory replenishment strategies by using techniques like economic order quantity (EOQ), just-in-time (JIT) inventory, or reorder point (ROP) analysis. These methods help ensure that inventory is replenished in a timely manner to meet demand and minimize stock-outs.
3. Carrying Cost of Inventory
The carrying cost of inventory is a KPI that measures the expenses associated with holding and storing inventory over a specific period. It represents the financial impact of maintaining inventory within a company.
Formula
The formula for calculating the carrying cost of inventory varies but typically includes:
Carrying Cost of Inventory =
Average Inventory Value x Carrying Cost Rate
Where:
- Average Inventory Value is the average dollar value of inventory held during a specific period.
- Carrying Cost Rate is the percentage or annual rate that represents the cost of carrying inventory, which includes factors like storage, insurance, depreciation, obsolescence, and financing costs.
Components of Carrying Cost
The carrying cost of inventory comprises various components, including:
- Storage Costs: These include expenses related to renting or owning warehouse space, utilities, maintenance, security, and equipment for storing inventory.
- Insurance Costs: The cost of insuring inventory against risks such as theft, damage, or natural disasters.
- Holding Costs: These encompass costs associated with handling inventory, including labor, handling equipment, packaging, and any additional costs incurred in managing and maintaining inventory.
- Opportunity Costs: The potential profit or return on investment that could have been earned if the funds tied up in inventory were used elsewhere.
- Obsolescence Costs: The financial impact of holding inventory that becomes outdated, expires, or loses value over time.
- Financing Costs: The interest or financing charges incurred if the company borrows money or uses credit to finance inventory.
Calculation Example
Let's consider the example of Company E to illustrate the calculation of the carrying cost of inventory:
Company E had an average inventory value of $200,000 for the year.
The carrying cost rate is estimated at 20% per year.
Carrying Cost of Inventory = $200,000 x 0.20 = $40,000
In this example, Company E's carrying cost of inventory is $40,000. This represents the expenses incurred in holding and managing inventory throughout the year.
Ways to Reduce Carrying Cost
Reducing the carrying cost of inventory is essential for optimizing inventory management and improving overall financial performance. Here are some strategies to consider:
- Inventory Optimization: Implement effective inventory planning and demand forecasting techniques to prevent overstocking and minimize excess inventory. By aligning inventory levels with demand, carrying costs associated with excess inventory can be reduced.
- Just-in-Time (JIT) Inventory: Adopt JIT inventory management practices to minimize the amount of inventory held in stock. JIT ensures that inventory is delivered or produced just in time to meet demand, reducing carrying costs associated with holding excessive inventory.
- Supplier Collaboration: Collaborate closely with suppliers to optimize lead times and order quantities. This can help reduce the need for excessive safety stock and minimize carrying costs.
- Obsolescence Management: Regularly assess inventory for obsolete or slow-moving items and take appropriate actions such as markdowns, promotions, or discontinuation to minimize obsolescence costs.
- Efficient Warehousing: Optimize warehouse (storeroom) operations to reduce storage and handling costs. Streamlining processes, improving layout and organization, and implementing efficient inventory management systems can help minimize carrying costs.
- Negotiate Better Terms: Work with suppliers to negotiate favorable terms, such as extended payment terms or volume discounts, which can help reduce financing costs associated with inventory.
4. Reorder Point Accuracy
Reorder point accuracy is a key inventory management KPI that measures the effectiveness of determining when to reorder spare parts or inventory items to prevent stockouts or excess inventory. It helps ensure that reorder points are set at the right levels, considering lead time and demand variability.
Formula
The formula for calculating reorder point accuracy is:
Reorder Point Accuracy =
(Number of Correct Reorders / Total Reorder Decisions) x 100
Where:
- Number of Correct Reorders refers to the number of times the reorder point decision was accurate.
- Total Reorder Decisions represents the total number of reorder decisions made.
A high reorder point accuracy indicates that spare parts and materials are reordered at the right time, preventing stockouts and minimizing excess inventory costs. It helps businesses strike a balance between having enough stock to meet demand and avoiding unnecessary carrying costs.
Interpreting reorder point accuracy involves analyzing the percentage of correct reorder decisions. A higher percentage suggests better accuracy in determining when to reorder. Conversely, a lower percentage indicates a higher likelihood of stockouts or excess inventory, leading to potential disruptions in maintenance activities or increased inventory holding costs.
Calculation Example
Company F made 100 reorder decisions for spare parts over a given period.
Out of those, 85 reorder decisions were accurate based on demand and lead time factors.
Reorder Point Accuracy = (85 / 100) x 100 = 85%
In this example, Company F has a reorder point accuracy of 85%. This means that 85% of the reorder decisions made were correct, ensuring that spare parts were reordered at the appropriate time with the right quantity.
Strategies to Improve Reorder Point Accuracy
Improving reorder point accuracy is important when trying to optimize inventory levels and avoid stockouts or excess inventory. The following are some guidelines to consider:
- Accurate Demand Forecasting: Implement robust demand forecasting techniques to accurately predict future demand for spare parts. This helps determine the appropriate reorder points based on anticipated demand patterns.
- Consider Lead Times: Conduct a thorough analysis of lead times for ordering and receiving spare parts. Look into variations in lead time due to supplier reliability, transportation, and customs clearance. Adjust reorder points accordingly to account for these lead time variations.
- Safety Stock Optimization: Evaluate the need for safety stock by considering demand variability and lead time fluctuations. Maintaining a buffer helps prevent stock outages during unexpected demand spikes or lead time delays.
- Data-Driven Decision Making: Leverage historical data, statistical models, and inventory management software (included in most CMMS platforms) to make data-driven reorder decisions. Utilize tools that consider demand variability, lead time, and service level requirements to determine accurate reorder points.
5. Back Order Rate
The Backorder Rate is a key performance indicator that measures the percentage of maintenance requests or work orders that cannot be fulfilled immediately due to the unavailability of inventory items. It indicates the frequency and impact of backorders in maintenance operations.
Formula
The formula for calculating the Back Order Rate is:
Backorder Rate =
(Number of Backordered Maintenance Requests / Total Number of Maintenance Requests) x 100
The backorder rate provides insights into the availability and management of inventory items. A high backorder rate may indicate inefficiencies or challenges in maintaining adequate stock levels to fulfill maintenance requests promptly. It can lead to delays in maintenance activities, increased downtime, and reduced overall operational efficiency.
Interpreting the backorder rate involves analyzing its impact on maintenance operations and customer satisfaction. A lower backorder rate suggests that maintenance requests can be fulfilled promptly, ensuring uninterrupted operations and meeting service level agreements.
Calculation Example
Let’s consider an example to illustrate the calculation of Back Order Rate:
Number of Backordered Maintenance Requests: 20
Total Number of Maintenance Requests: 100
Backorder Rate = (Number of Backordered Maintenance Requests / Total Number of Maintenance Requests) x 100
= (20 / 100) x 100 = 20%
In this example, the backorder rate is 20%, indicating that 20% of maintenance requests could not be fulfilled immediately due to inventory unavailability.
Strategies to Improve Backorder Rate
Here are some strategies to improve the backorder rate:
- Accurate Demand Forecasting: Utilize historical maintenance data and trends to forecast the demand for inventory items accurately. This helps in ensuring optimal inventory levels to meet maintenance requirements promptly.
- Safety Stock and Reorder Point Optimization: Set appropriate safety stock levels and reorder points based on maintenance demand patterns and lead times. This ensures that inventory items are replenished before running out, reducing the risk of backorders.
- Supplier Collaboration: Establish strong relationships with suppliers to improve lead times and response to urgent maintenance requests. Collaborating closely with suppliers helps in obtaining timely deliveries and reducing backorder occurrences.
Customizing KPIs for Industry-Specific Needs
Different industries have distinct characteristics and requirements when it comes to inventory management. Customizing key performance indicators (KPIs) based on industry-specific needs is important for accurate measurement and effective decision-making. Let's explore industry-specific KPIs for the retail, manufacturing, energy and utilities, and healthcare sectors.
1. Retail Industry
1.1 Sell-Through Rate
This KPI measures the percentage of inventory sold within a specific period, reflecting the efficiency of inventory turnover and sales performance.
1.2 Stock-to-Sales Ratio
This KPI compares the value of inventory on hand to the sales generated, indicating the balance between inventory levels and demand.
1.3 Gross Margin Return on Inventory Investment (GMROII)
This KPI calculates the gross margin generated per dollar invested in inventory, helping retailers optimize profitability.
2. Manufacturing Industry
2.1 Production Cycle Time
This KPI measures the time required to produce finished goods, providing insights into manufacturing efficiency and responsiveness to demand.
2.2 First Pass Yield (FPY)
This KPI evaluates the percentage of products that meet quality standards during the initial production run, indicating manufacturing effectiveness and minimizing waste.
2.3 Order Lead Time
This KPI measures the time it takes from order placement to delivery, ensuring timely fulfillment of demands.
3. Energy & Utilities Industry
3.1 Asset Availability
This KPI assesses the availability and reliability of critical assets, such as equipment or infrastructure, ensuring uninterrupted operations and minimizing downtime.
3.2 Inventory Turnover for Spare Parts
This KPI measures the frequency at which spare parts are used or replaced, optimizing inventory levels to support maintenance and repairs.
3.3 Material Cost Variance
This KPI evaluates the variance between estimated and actual costs for materials used, helping manage and control expenses.
4. Healthcare Industry
4.1 Days in Inventory
This KPI calculates the average number of days medical supplies or pharmaceuticals remain in inventory, ensuring adequate stock levels without excess holding costs.
4.2 Order Accuracy
This KPI measures the percentage of accurate and error-free medical supply orders, supporting patient care and minimizing disruptions.
4.3 Shelf Life Compliance
This KPI tracks the compliance with expiration dates and ensures the timely utilization of perishable medical supplies.
Please note that these are just a few examples of industry-specific KPIs, and each industry may have additional KPIs tailored to their specific requirements. It is important for organizations to identify the most relevant KPIs based on their industry and unique operational characteristics.
Aligning Inventory KPIs with Business Goals and Objectives
To maximize the effectiveness of inventory management, it’s important to align key performance indicators (KPIs) with the specific goals and objectives of a business. This ensures that KPIs accurately reflect the company's strategic direction and provide meaningful insights for decision-making. Consider the following when aligning KPIs with business goals and objectives:
Defining Key Metrics for Specific Goals
Each business goal or objective requires a set of KPIs that directly measure progress and success. When defining KPIs, it is essential to identify the metrics that align with specific goals. For example:
- If the goal is to optimize inventory turnover, relevant KPIs would include inventory turnover ratio, sell-through rate, and days in inventory.
- If the goal is to improve customer satisfaction, KPIs such as order fill rate, on-time delivery rate, and order accuracy can provide valuable insights.
Ensuring KPIs Reflect Business Strategy
KPIs should be closely tied to the overall business strategy. They should align with the strategic priorities of the organization and reflect the key factors that drive success. For example:
- If the business strategy emphasizes cost leadership, KPIs related to cost of goods sold, carrying cost of inventory, and supplier performance should be prioritized.
- If the focus is on product innovation and differentiation, KPIs related to new product introduction cycle time and product quality can be given more importance.
Adapting KPIs as Business Evolves
Regularly reassessing KPIs allows organizations to remain responsive and ensure that the metrics being measured align with current business needs. Factors to consider include:
- Industry trends and market demands: KPIs should adapt to changes in market conditions, and industry best practices.
- Technological advancements: The adoption of new technologies may necessitate the inclusion of KPIs related to automation, data analytics, or supply chain visibility.
- Organizational goals: As business objectives shift, KPIs should be adjusted to reflect the updated priorities.
Implementing and Monitoring Inventory Management KPIs
Data Collection and Management Systems
To effectively implement and monitor inventory management key performance indicators (KPIs), businesses need robust data collection and management systems in place. Here are key considerations for data collection:
- Data Sources: Identify the relevant data sources, such as point-of-sale systems, inventory management software, CMMS software, supply chain systems, and financial records. Ensure data accuracy and consistency across these sources.
- Data Integration: Integrate data from various sources to create a centralized and comprehensive view of inventory-related information. This allows for a holistic analysis and reporting of KPIs.
- Automation: Leverage technology and automation tools to streamline data collection processes. This reduces manual errors, enhances efficiency, and provides real-time insights into inventory performance.

Establishing Baselines and Targets
Establishing baselines and targets are essential for measuring progress and setting benchmarks for inventory management KPIs. Here's how to establish baselines and targets:
- Baseline Assessment: Conduct an initial assessment to determine the current state of inventory management KPIs. Measure and record the relevant metrics, establishing a starting point for performance evaluation.
- Setting Targets: Based on industry benchmarks, historical performance, and strategic objectives, set realistic and measurable targets for each KPI. Targets should be challenging yet attainable, motivating the organization to strive for continuous improvement.
- Alignment with Goals: Ensure that the targets align with the broader goals and objectives of the business. This ensures that the KPIs drive the desired outcomes and support the company's strategic direction.
Regular Monitoring and Reporting
Regular monitoring and reporting are important for tracking progress, identifying trends, and making data-driven decisions. Consider the following steps:
- Frequency of Monitoring: Determine the appropriate frequency for monitoring and reporting KPIs based on the specific needs of the business. It could be weekly, monthly, quarterly, or annually, depending on the nature of the KPI and the pace of business operations.
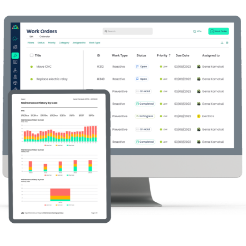
- Visualization and Dashboards: Utilize data visualization aids and dashboards to present KPIs in a clear and concise manner. This facilitates easy interpretation and enables stakeholders to quickly grasp the performance trends.
- Exception Reporting: Implement exception reporting to highlight significant deviations from targets or notable trends. This allows for proactive actions to address issues and capitalize on opportunities.
Continuous Improvement and Adjustments of Inventory KPIs
Continuous improvement and adjustments are essential for optimizing inventory management KPIs. By regularly analyzing performance, conducting root cause analysis, optimizing processes, and fostering a culture of continuous learning, businesses can drive ongoing excellence in inventory management. Embracing a mindset of continuous improvement enables organizations to stay agile, address gaps, and achieve strategic objectives in inventory management.
TABLE OF CONTENTS