David Green | 11 Jul 2023


The ability to optimize maintenance management strategies not only enhances equipment performance but also minimizes downtime and reduces costs. One tool that aids maintenance managers in achieving these objectives is the P-F Curve, also known as the Prevention Failure Curve. It helps maintenance professionals make informed decisions regarding resource allocation, maintenance planning, and long-term asset management.
What is the P-F Curve?
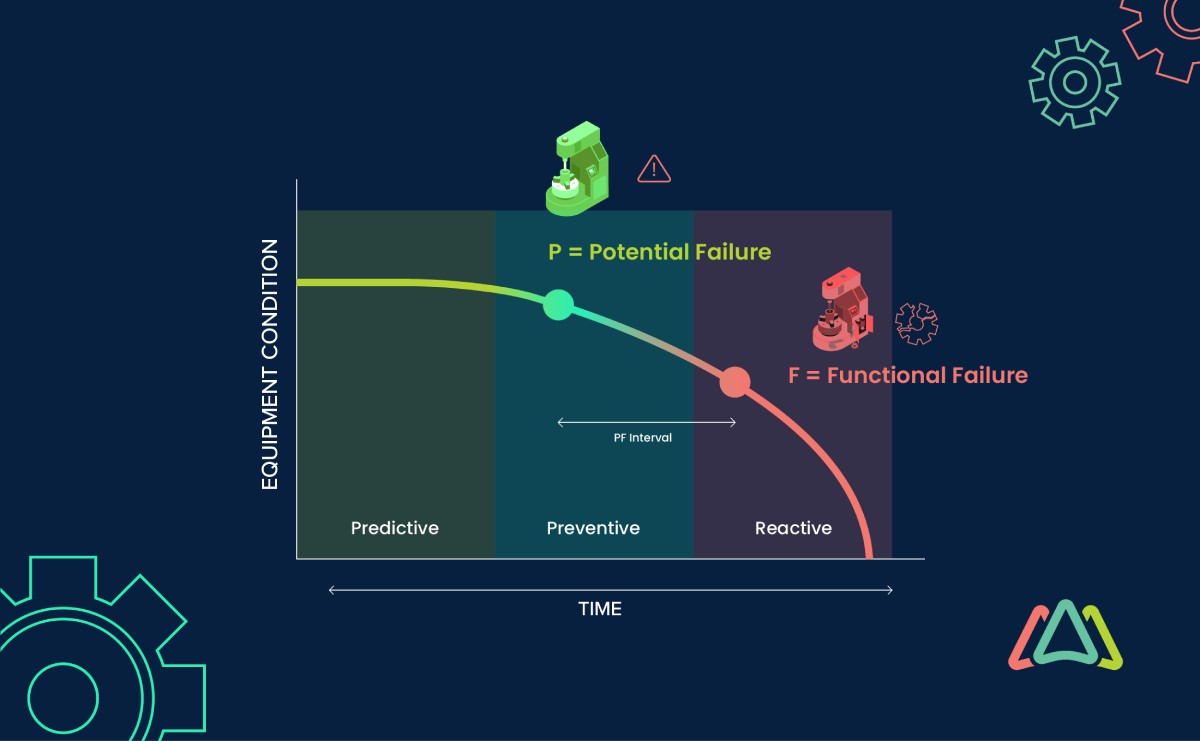
The P-F Curve provides a visual representation of the degradation process of equipment and assets over time. It demonstrates how the equipment’s performance gradually declines from the potential failure stage (P) towards the functional failure stage (F). The curve helps organizations understand the relationship between proactive maintenance actions taken during the P phase and the resulting impact on preventing or delaying functional failures.
Potential failure here refers to the stage where equipment shows signs of degradation or deviations from normal operating conditions. It serves as a warning sign that proactive maintenance intervention may be required to prevent the equipment from reaching the point of functional failure. By detecting potential failures early through inspections, monitoring, and data analysis, maintenance teams can implement preventive or predictive maintenance measures to mitigate the risks associated with functional failure.
Functional failure, on the other hand, represents the actual loss of equipment functionality. It occurs when the equipment can no longer perform its intended function, leading to unplanned downtime, reduced productivity, and potential consequences such as safety hazards or customer dissatisfaction. Functional failures typically result from unaddressed potential failures or unforeseen circumstances.
The primary purpose of the PF Curve is to enable organizations to make informed decisions regarding maintenance strategies and resource allocation. By studying the curve, companies can identify optimal intervals for performing maintenance activities, including inspections, repairs, and component replacements. This proactive approach helps extend the useful life of assets, enhance operational efficiency, and minimize unplanned downtime.
Graphical Representation of the P-F Curve
The PF Curve is typically depicted graphically, providing a visual representation of the degradation and failure process of systems and assets over time. The graphical representation helps in understanding the relationship between potential failure (P) and functional failure (F), and allows organizations to make informed decisions regarding maintenance interventions.
Here are the key components of the PF Curve:
1. X-axis Representing Time
The X-axis of the PF Curve represents the progression of time. It is typically labeled in chronological units, such as days, months, or years, depending on the expected lifespan or operating cycle of the system or asset being analyzed. The X-axis helps track the evolution of the system's functional state over time.
2. Y-axis Representing the System's Functional State
The Y-axis of the P-F Curve represents the functional state or performance of the equipment or asset being analyzed. It is typically measured using appropriate metrics, such as reliability, availability, performance efficiency, or any other relevant indicators. The Y-axis quantifies the system's ability to perform its intended function and reflects its degradation or deterioration over time.
3. Plotting the P and F points on the curve
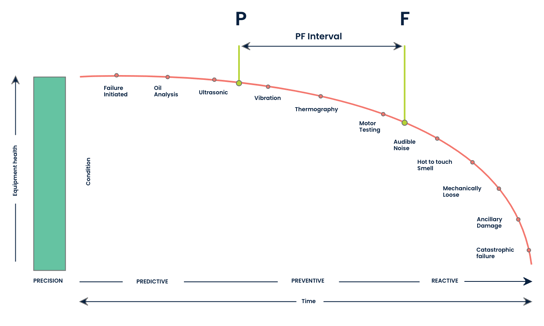
The PF Curve is plotted by identifying and marking the points of potential failure (P) and functional failure (F) on the graph. The P point represents the earliest detection of signs indicating potential failure or degradation. The F point represents the occurrence of functional failure, where the system's performance falls below an acceptable threshold. These points are plotted at specific coordinates on the graph, reflecting the corresponding time and the functional state of the system at those instances.

Factors Influencing the Shape of the PF Curve
The shape of the PF Curve can vary depending on several factors that influence the degradation and failure process of systems and assets. Understanding these factors is critical for accurately assessing and managing the PF Curve. Here are three key factors that influence the shape of the PF Curve:
1. Nature of the Asset being Analyzed
The characteristics and complexity of the asset under consideration play a significant role in shaping the PF Curve. Different types of systems, such as mechanical, electrical, or software-based, exhibit distinct failure patterns. For example, mechanical systems may experience wear and tear over time, leading to gradual degradation, while software-based systems may be prone to software bugs and compatibility issues. The design, materials used, and expected lifespan of the system or asset also contribute to the shape of the PF Curve.
2. Maintenance Strategies Employed
The maintenance strategies and practices implemented by an organization have a direct impact on the PF Curve. A proactive and well-executed maintenance program can effectively delay or prevent functional failures, resulting in a more gradual degradation curve. On the other hand, reactive maintenance practices may lead to a steeper decline in performance, causing functional failures to occur more rapidly. The frequency and type of maintenance activities, such as preventive maintenance, condition monitoring, and corrective maintenance, influence the shape and slope of the PF Curve.
3. Environmental and Operational Conditions

The operating environment and conditions in which the system or asset operates significantly influence its degradation and failure process. Harsh environmental factors where the asset is exposed to extreme temperatures, humidity, vibrations, or corrosive substances, can accelerate deterioration and shorten the time between potential failures and functional failures. Similarly, demanding operational conditions where the asset experiences high usage rates, heavy loads, or continuous operation, can place additional stress on the system, leading to faster degradation. Conversely, favorable environmental and operational conditions can extend the P-F interval and flatten the P-F Curve.
Organizations should evaluate the specific characteristics of their assets, review and improve maintenance strategies and practices, and account for environmental and operational conditions to optimize the reliability and performance of their assets. By understanding these factors, organizations can proactively intervene during the potential failure stage, prolong the P-F interval, and maximize the overall lifespan of their systems and assets.
The P-F Interval and its Importance
The P-F interval is illustrated as the distance or duration between the P and F points on the P-F Curve. It signifies the window of opportunity organizations have to detect and address potential failures before they escalate into functional failures. The length of the P-F interval is an essential indicator of the system's reliability and the effectiveness of proactive maintenance practices.
A longer P-F interval indicates a more proactive maintenance approach and a better ability to anticipate and mitigate potential failures. By optimizing the P-F interval, organizations can minimize downtime, reduce repair costs, and improve equipment reliability and availability.
Here's why the P-F interval is important:
1. Early Intervention
The P-F interval allows organizations to proactively intervene during the potential failure stage, enabling timely maintenance to eliminate risks. By addressing potential failures early on, organizations can prevent or delay functional failures, thereby reducing downtime, avoiding safety hazards, and minimizing the impact on operations.
2.Cost Optimization
Detecting and addressing potential failures during the P-F interval is generally more cost-effective compared to dealing with functional failures. The cost of repairs, replacements, and system downtime is often higher when functional failures occur. By maximizing the P-F interval, organizations can reduce maintenance costs, improve resource allocation, and reduce the overall costs over the life of their assets.
3. Reliability Improvement
Maximizing the P-F interval leads to enhanced system reliability. By implementing proactive maintenance and mitigation strategies during the potential failure stage, organizations can maintain the system's performance closer to its optimal state over a longer period of time. This results in improved reliability, increased availability, and enhanced operational performance.
Factors Influencing the Length of the P-F interval
Several factors influence the length of the P-F interval. Understanding these factors helps organizations optimize maintenance practices and effectively manage the interval. Here are three key factors influencing the length of the P-F interval:
1. Maintenance Practices and Strategies
Proactive and well-executed maintenance approaches, such as preventive maintenance and condition-based maintenance, increase the chances of detecting and addressing potential failures early, thus extending the P-F interval.
In contrast, reactive or run-to-fail may result in shorter P-F intervals, leading to frequent functional failures.
2. System Design and Quality
The design and quality of the system or asset play a vital role in determining the length of the P-F interval. Robust system design, high-quality components, and adherence to industry standards can contribute to longer P-F intervals.
Conversely, systems with inherent design flaws, poor component quality, or inadequate durability may experience shorter P-F intervals.
3. Environmental and Operational Conditions
Environmental and operational conditions significantly influence the P-F interval. Harsh environmental factors, such as extreme temperatures, humidity, or corrosive substances, can accelerate degradation and shorten the P-F interval. Similarly, demanding operational conditions, including heavy loads, high usage rates, or reactive maintenance (run-to-fail), can expedite the progression from potential failure to functional failure.
Conversely, favorable environmental and operational conditions can help extend the P-F interval.
Strategies to Maximize the P-F Interval
To maximize the P-F interval and enhance asset reliability, organizations can adopt various strategies and best practices. Here are three key strategies to consider:
1. Effective Maintenance Planning and Scheduling
Regular inspections, preventive maintenance activities, and component replacements should be scheduled based on the system's degradation patterns and criticality. By adhering to a proactive maintenance schedule, organizations can detect and address potential failures before they lead to functional failures.

2. Condition-Based Maintenance Approach
Implement condition-based maintenance (CBM) approaches to optimize the P-F interval by leveraging real-time data and monitoring techniques. By continuously monitoring system health, performance, and signs of degradation, organizations can detect potential failures early on. This enables targeted maintenance actions based on actual asset condition, improving the efficiency and effectiveness of maintenance efforts.
3. Advanced Monitoring and Diagnostic Technologies
Leveraging advanced monitoring and diagnostic technologies, such as sensors, data analytics, and predictive modeling, can significantly enhance the ability to maximize the P-F interval. These technologies enable real-time monitoring of system parameters, identification of degradation patterns, and early detection of potential failures. By leveraging data-driven insights, organizations can make better maintenance decisions, optimize resource allocation, and extend the P-F interval.
4. Reliability-Centered Maintenance (RCM)
RCM focuses on identifying and prioritizing critical assets and failure modes to optimize maintenance strategies. By conducting thorough risk assessments and analyzing the PF Curve, organizations can develop tailored maintenance plans that target potential failures during the P phase. This approach optimizes resource allocation, reduces costs, and improves asset reliability.
5. Proactive Component Replacement
Proactively replace components before they reach the functional failure point to prevent unexpected breakdowns and minimize the adverse impact on operations. This is particularly effective in industries where component reliability is critical, such as aerospace or where medical devices are involved.
6. Root Cause Analysis (RCA)
When functional failures occur despite proactive maintenance efforts, conducting RCA helps identify the underlying causes. By analyzing the PF Curve leading up to the failure event, organizations can pinpoint the factors that contributed to the failure. This information enables them to implement corrective actions, such as design improvements, process changes, or training programs to prevent similar failures in the future.
7. Continuous Improvement and Feedback Loop
The PF Curve analysis should be an iterative process that feeds into continuous improvement efforts. By continuously monitoring asset performance, updating the P-F Curve, and reviewing maintenance strategies, organizations can identify areas for improvement. Regular feedback loops ensure that maintenance and reliability strategies evolve over time to maximize the P-F interval and enhance asset performance.
Practical Applications and Benefits of the PF Curve
1. Asset Management and Reliability Engineering
The PF Curve has several practical applications in asset management and reliability engineering. It serves as a valuable tool for organizations to optimize the maintenance and management of their systems and assets. Here are some practical applications of the PF Curve in asset management and reliability engineering:
1.1 Predictive Maintenance
The PF Curve helps organizations identify potential failure points and plan maintenance activities proactively. By analyzing the curve, organizations can implement predictive maintenance strategies, such as condition monitoring and predictive analytics, to detect potential failures before they result in functional failures. This approach optimizes maintenance efforts and reduces the likelihood of unexpected breakdowns or downtime.
1.2 Asset Lifecycle Management
The PF Curve provides insights into the degradation and failure process of assets over time. Organizations can utilize this information to develop comprehensive asset lifecycle management strategies. By understanding the expected lifespan, potential failure modes, and critical failure points of assets, organizations can make informed decisions regarding repair, replacement, or refurbishment. This approach ensures maximum asset performance and return on investment.
1.3 Reliability Improvement
The PF Curve enables organizations to identify areas for reliability improvement. By analyzing the curve's shape, organizations can pinpoint critical failure points, assess the effectiveness of maintenance practices, and identify opportunities for process optimization or component upgrades. This proactive approach enhances the overall reliability and availability of systems and assets.
2. Decision-Making and Resource Allocation
The PF Curve provides organizations with valuable insights into the condition and health of their assets, helping them make informed decisions regarding maintenance strategies, resource allocation, and capital investments. Here's how the PF Curve contributes to decision-making and resource allocation:
2.1 Optimal Maintenance Strategies
By analyzing the PF Curve, organizations can determine the most effective maintenance strategies for their assets. They can identify critical points on the curve where maintenance interventions are necessary to prevent functional failures. This information helps organizations optimize the allocation of resources, such as manpower, time, and budget, for maintenance activities.
2.2 Prioritization of Maintenance Actions
The PF Curve assists organizations in prioritizing maintenance actions based on the criticality of potential failures. By understanding the progression of degradation and the expected time to functional failure, organizations can allocate resources to address potential failures that pose the highest risks to safety, operational efficiency, or production output. This prioritization ensures that resources are utilized most effectively.
2.3 Capital Expenditure Planning
The PF Curve provides insights into the expected lifespan and degradation patterns of assets. Organizations can utilize this information to plan capital expenditures for asset replacement or refurbishment. By considering the projected P-F interval and the costs associated with potential failures, organizations can make well-informed decisions regarding capital investments, ensuring that limited resources are allocated wisely.
3. Cost Optimization and Risk Reduction
The PF Curve offers significant benefits in terms of reducing costs and other risks. By effectively managing the P-F interval and implementing proactive maintenance strategies, organizations can optimize costs and minimize risks associated with asset failures. Here's how the PF Curve contributes to cost optimization and risk reduction:
3.1 Minimized Downtime and Production Losses
Proactive maintenance interventions based on the P-F Curve enable organizations to prevent or delay functional failures. By addressing potential failures during the P phase, organizations can minimize downtime and production losses associated with unexpected breakdowns. This leads to improved operational efficiency, reduced revenue losses, and better production output.
3.2 Reduced Repair and Replacement Expenses
By implementing proactive maintenance measures, potential failures can be identified and addressed before they escalate into more severe failures. This reduces the likelihood of larger repairs or being required to replace the asset altogether, resulting in significant cost savings.
3.3 Mitigated Safety Hazards and Operational Risks
Addressing potential failures during the P-F interval helps organizations mitigate safety hazards and operational risks. By identifying and resolving potential failures, organizations can prevent equipment malfunctions and accidents. This proactive approach ensures a safer working environment, reduces the potential for injuries or damage, and minimizes the associated legal and damage to the organization’s reputation.
3.4 Better Cost Management of Maintenance Efforts
Optimizing the P-F interval through proactive maintenance strategies improves the cost-effectiveness of maintenance efforts. By identifying and addressing potential failures early, organizations can allocate resources more efficiently, reduce the frequency of reactive maintenance, and avoid unnecessary or premature component replacements. This leads to improved cost control.
Characteristics of Different PF Curves
The shape and characteristics of PF Curves vary based on the specific system or asset being analyzed. Different assets exhibit distinct degradation patterns and failure modes. Here are a few examples of the shape and characteristics of PF Curves:
1. Wear and Tear Degradation
With mechanical systems, such as pumps or compressors, the PF Curve may exhibit a gradual and linear degradation pattern. As wear and tear progress, the functional state gradually declines until it reaches the functional failure point. This type of curve indicates a predictable degradation process, allowing maintenance teams to schedule component replacements before functional failures occur.
The P-F interval in this case is relatively longer, allowing proactive maintenance interventions.
2. Age-related Degradation
Some assets experience age-related degradation, where the PF Curve shows a gradual decline over time. As the asset ages, its performance gradually deteriorates until it reaches the functional failure point. This type of curve emphasizes the importance of proactive maintenance to extend the asset's lifespan and optimize performance.
The P-F interval gradually shortens as the asset approaches its functional failure point.
3. Abrupt Failure
In certain systems or components, the PF Curve may exhibit a relatively flat profile until it abruptly drops to the functional failure point. The curve remains relatively stable for a period, indicating a system or component that shows little or no early warning signs of potential failure. However, once the failure point is reached, there is a steep drop in the functional state of the asset with little or no early warning signs. For such assets, implementing condition monitoring techniques, such as vibration analysis or thermography, becomes critical to detect potential failures before they lead to functional failures.
The P-F interval in this case is typically shorter, emphasizing the need for timely monitoring and maintenance actions.
While the P-F Curve provides valuable insights, it's important to acknowledge that its application requires ongoing monitoring, analysis, and continuous improvement. Organizations should strive to establish a feedback loop and learn from case studies and real-world examples. By leveraging advanced monitoring technologies, data analytics, and root cause analysis, organizations can refine their maintenance practices, mitigate risks, and achieve higher levels of asset reliability.
TABLE OF CONTENTS