


Reena Sommer | 14 Jul 2026
Share this page:


The Complete Guide to Maintenance Backlog Reduction
Introduction
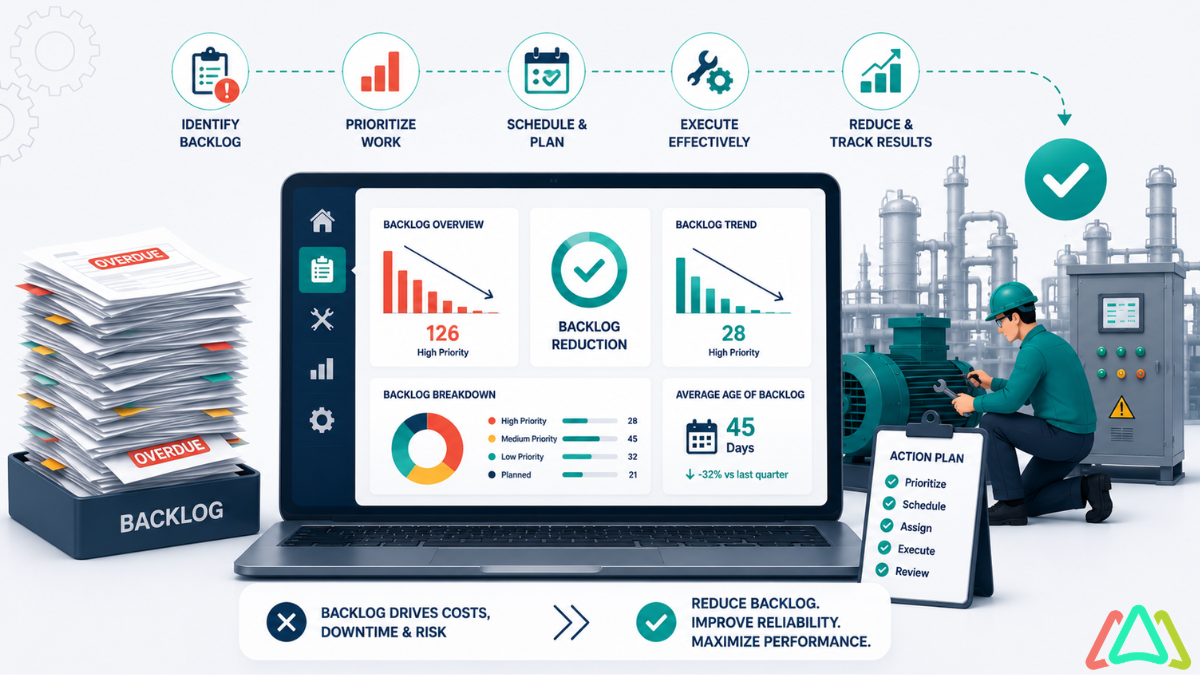
A growing maintenance backlog is a telltale sign that the maintenance team is falling behind. When too much work sits unplanned or unfinished, teams face a growing work-order backlog, greater asset risk, and increasing deferred maintenance.
Reducing maintenance backlog requires more than just working faster. It requires accurate measurement, smart prioritization, and a reliable planning system. This guide covers defining, measuring, and prioritizing the backlog, as well as managing deferred maintenance effectively.
What Maintenance Backlog Means
Maintenance backlog is the total amount of approved maintenance work that has not yet been completed. It is usually measured in labor hours or crew weeks, rather than solely by the number of open tickets. For example, eMaint defines the maintenance backlog as a metric that assigns a numeric value to maintenance tasks still in the queue, expressed in workweeks.
A work order backlog is the open portion of that workload, consisting of maintenance work orders awaiting planning, scheduling, or execution. In other words, it is the work your team knows needs to be done but has not finished yet.
Many maintenance teams overlook estimated time, costs, and other resources and only track the number of work orders. IDCON notes that backlog should be assessed using labor estimates, because a small number of large jobs can pose a much bigger problem than a long list of minor tasks.
It is also important to distinguish backlog from deferred maintenance. APPA defines deferred maintenance as preventive, predictive, or corrective maintenance that assets and systems should have undergone but have not yet received.
A simple explanation
- Maintenance backlog = all identified maintenance work waiting to be completed.
- Work order backlog = open approved work orders still in the system
- Deferred maintenance = work that should already have been done but was postponed
Causes of Backlogs
A high-maintenance backlog rarely stems from a single issue. Most often, it builds gradually through weak planning, poor prioritization, and resource constraints.
One common cause is poor screening of work requests. If requests enter the system without proper review, teams end up with too many low-value or unclear jobs competing for the same labor. IDCON emphasizes that work requests should be screened and estimated early so organizations can understand the true size of their backlog.
Another major cause is inaccurate or missing labor estimates. If maintenance leaders only count work orders and do not estimate hours, the backlog appears smaller than it really is. That makes capacity planning difficult and delays action until the work order backlog becomes unmanageable.
Backlogs also grow when too much work is marked urgent. IDCON notes that when many work orders carry high priority codes, teams lose the ability to tell which work is truly most important.
A fourth cause is the shift from proactive to reactive work. When preventive tasks are repeatedly delayed, they eventually result in breakdowns, emergency repairs, and deferred maintenance. eMaint points out that predictive and risk-based maintenance practices help reduce future backlog growth.
Common causes of a growing maintenance backlog
- Weak work request screening
- Missing or unrealistic labor estimates
- Too many emergency or high-priority jobs
- Limited labor capacity
- Material or parts shortages
- Repeated breakdowns from deferred preventive work
- Poor planning and scheduling discipline
Measuring Backlog
If you want to succeed in reducing the maintenance backlog, you need a clear, repeatable way to measure it.
Maintenance backlog formula
Here is a widely used formula from eMaint:
[
\text{Maintenance Backlog (weeks)} = \frac{\text{Hours Worth of Work}}{\text{Hours of Weekly Capacity}}
]
Example:
- 3 technicians
- 40 hours per technician per week
- Weekly capacity = 120 hours
- Planned maintenance work = 1,200 hours
[
\frac{1200}{120} = 10
]
This formula identifies an organization with a 10-week maintenance backlog.
Crew week formula
IDCON explains backlog in terms of crew weeks:
[
\text{1 Crew Week} = \text{Number of Technicians} \times \text{Weekly Hours}
]
Example:
[
10 \times 40 = 400 \text{ labor hours per week}
]
So, if your team has 2,400 hours of open work and can deliver 400 labor hours per week, you have:
[
\frac{2400}{400} = 6 \text{ crew weeks of backlog}
]
IDCON states that in many process industries, a best-practice target is 4–6 crew weeks for total weekly and daily work, while some industries, such as pharma and food, may target 2–4 weeks.
Alternatively, SMRP cites 2–4 weeks as the best-in-class range for Ready Backlog, which represents work that is fully planned and ready for execution.
Weekly backlog change formula
To monitor whether backlog is improving or worsening, use:
[
\text{Backlog Change} = \text{Hours Added This Week} - \text{Hours Completed This Week}
]
- If the result is positive, the backlog is growing
- If the result is zero, the backlog is stable
- If the result is negative, the backlog is shrinking
KPI table for backlog management
|
KPI |
Formula |
What it measures |
Why it matters |
|
Maintenance Backlog (weeks) |
Open backlog hours ÷ weekly labor capacity |
Total backlog size |
Shows how long it would take to clear open work |
|
Ready Backlog (weeks) |
Ready-to-execute hours ÷ weekly labor capacity |
Planned work is ready for crews |
Shows whether planners are feeding execution |
|
Work Order Backlog Aging |
Average age of open work orders |
How old is Open Work |
Helps identify neglected work |
|
Added vs. Completed Work Ratio |
Added hours ÷ completed hours |
Whether the backlog is growing |
Above 1.0 means backlog is increasing |
|
Deferred Maintenance Hours |
Total postponed maintenance hours |
Extent of deferred work |
Highlights long-term reliability risk |
|
PM-to-CM Ratio |
Preventive maintenance hours ÷ corrective maintenance hours |
Balance of proactive vs reactive work |
A higher proactive share usually reduces future backlog |
Here’s a simple explanation
A healthy maintenance backlog is not zero. Teams need enough planned work to stay productive. The goal is a controlled backlog, not a chaotic one.
Prioritizing Work Orders
It’s not possible to reduce a work order backlog effectively unless you prioritize the right jobs first.
FMX recommends prioritizing maintenance work based on safety, operational impact, compliance requirements, cost implications, and resource availability.
That means not every work order deserves the same urgency. A leaking roof over electrical equipment should take precedence over a cosmetic wall repair. A fire alarm issue should take precedence over a minor comfort complaint.
Simple work order priority levels
|
Priority Level |
Description |
Typical examples |
Recommended response |
|
Emergency |
Immediate threat to safety or critical operations |
Fire alarm failure, flooding, and electrical fire |
Respond immediately |
|
Urgent |
Serious issue that could escalate quickly |
HVAC failure, critical equipment malfunction |
Schedule quickly |
|
Preventive or Routine |
Important but not immediately disruptive |
Inspections, lubrication, calibration |
Plan and schedule |
|
Non-Critical |
Low-risk work with limited operational impact |
Cosmetic repairs, minor nuisance issues |
Bundle or defer carefully |
This structure aligns with FMX’s work-order-priority approach.
Sample work order prioritization formula
A simple internal scoring method can help standardize decisions:
[
\text{Priority Score} = (\text{Safety} \times 4) + (\text{Operational Impact} \times 3) + (\text{Compliance} \times 2) + (\text{Cost Risk} \times 1)
]
Use a scale of 1 to 5 for each factor. Higher scores indicate higher priority.
Best practices for prioritizing work orders
- Put safety first
Any job with a clear safety impact should move to the top of the list. - Protect critical production assets.
Work affecting bottleneck equipment or critical systems should be elevated. - Do not sacrifice compliance work.
Regulatory tasks should never be pushed aside until they become urgent. - Protect preventive work
If preventive tasks are always delayed, today’s minor issues become tomorrow’s deferred maintenance. - Review the aging backlog weekly.
Older jobs often become more expensive, more disruptive, and more urgent over time.
Reducing Deferred Maintenance
Reducing maintenance backlog and deferred maintenance requires more than a one-time cleanup. You need a disciplined operating process.
1. Screen and approve work properly
Not every request should become part of the active backlog. Review incoming work to confirm that it is necessary, clear, and estimated. IDCON stresses the importance of screening work before it enters the system as active work orders.
2. Estimate labor hours consistently
A backlog measured only by ticket count is misleading. Measure work in labor hours so you can compare demand to available capacity and take action sooner.
3. Separate shutdown work from routine backlog
IDCON recommends calculating the normal weekly and daily backlogs separately from the shutdown backlog. This creates a more accurate view of true execution pressure.
4. Protect preventive and predictive maintenance
eMaint recommends using predictive maintenance and risk-based decision-making to reduce unexpected failures. This lowers future work order backlog and prevents deferred maintenance from accelerating.
5. Use capacity levers when backlog stays high
If backlog continues to grow, IDCON identifies four main ways to reduce it:
- Move resources between areas
- Use overtime
- Hire contractors
- Add more craftspeople if backlog growth is a long-term trend
6. Review backlog every week
A practical weekly backlog review should answer:
- How many labor hours were added this week?
- How many hours were completed?
- Which work orders are aging?
- Which preventive jobs were deferred?
- Which jobs are planned and ready to execute?
7. Run focused cleanup campaigns
When a backlog becomes excessive, attack it in structured waves. For example:
- Close obsolete work orders
- Re-estimate long-open jobs
- Bundle similar low-risk tasks
- Target aging critical work with overtime or contractor support
KPI table for reducing maintenance backlog
|
Objective |
KPI |
Formula |
Desired trend |
|
Shrink backlog |
Backlog weeks |
Open backlog hours ÷ weekly capacity |
Down |
|
Reduce deferred maintenance |
Deferred maintenance hours |
Total postponed maintenance hours |
Down |
|
Improve flow |
Added vs. completed ratio |
Added hours ÷ completed hours |
Below 1.0 |
|
Improve readiness |
Ready backlog share |
Ready backlog hours ÷ total backlog hours |
Up |
|
Reduce aging |
Average work order age |
Total age of open work orders ÷ number of open work orders |
Down |
Simple explanation
The fastest path to reducing maintenance backlog is not “do everything now.” It is:
- clean up the incoming work stream
- prioritize correctly
- protect preventive work
- match labor capacity to actual demand
FAQ
What is maintenance backlog?
Maintenance backlog is the total amount of approved maintenance work that has not yet been completed, typically measured in labor hours or work weeks rather than by work order count alone.
What is a work order backlog?
A work order backlog is the set of open maintenance work orders awaiting planning, scheduling, or completion. It is the operational view of outstanding maintenance demand.
What is deferred maintenance?
APPA defines deferred maintenance as preventive, predictive, or corrective maintenance that assets and systems should have undergone but have not yet received.
What is a good maintenance backlog target?
SMRP cites 2–4 weeks as a best-in-class target for Ready Backlog, while IDCON says many process industries operate with 4–6 crew weeks of total weekly and daily backlog.
Why is reducing maintenance backlog important?
Reducing maintenance backlog helps prevent delayed repairs, lower asset reliability, rising emergency work, and growing deferred maintenance. It also improves scheduling, resource use, and operational stability.
What is the first step in reducing maintenance backlog?
The first step is to accurately measure backlog in labor hours, not just the number of work orders. Once the backlog size is visible, teams can prioritize and allocate resources more effectively.
Conclusion:
A well-managed maintenance backlog is not a sign of failure. It is a sign that work is visible, measurable, and controlled. The real problem begins when the work order backlog grows faster than your team’s capacity, leading to widespread deferred maintenance.
By measuring backlog in hours, prioritizing work orders by risk, and building a system to reduce maintenance backlog, maintenance leaders can improve reliability, protect assets, and keep operations running smoothly.
TABLE OF CONTENTS





Keep Reading
You should switch maintenance platforms when the current system creates more maintenance ...
12 Oct 2026
Keeping accurate records of equipment maintenance is essential for any organization that ...
5 Oct 2026
Small businesses start managing equipment maintenance with whatever tools are already ...
5 Oct 2026
A maintenance technician is ready to repair a critical piece of equipment, but the ...
2 Oct 2026
Assigning the right work order to the right maintenance technician sounds simple. A ...
2 Oct 2026
A broken door handle gets reported by email. An employee texts a technician about a leaking ...
1 Oct 2026
Even for small maintenance teams, investing in CMMS software is worthwhile when manual ...
1 Oct 2026
Managing a maintenance budget is one of the most important responsibilities for maintenance ...
1 Oct 2026
Managing maintenance across a single school or school district becomes complicated as the ...
29 Sep 2026
Executive Directors are responsible for much more than day-to-day operations. They oversee ...
29 Sep 2026
Managing a maintenance budget is one of the most important responsibilities for maintenance ...
29 Sep 2026
Maintenance Directors should look for CMMS software that makes it easier to manage work ...
28 Sep 2026
Facility maintenance software can help Maintenance Managers control costs by improving ...
28 Sep 2026
Facility management software improves preventive maintenance by helping Maintenance Managers ...
28 Sep 2026
When a classroom door will not close, an HVAC unit stops working, or a sink begins leaking, ...
28 Sep 2026
Many facility maintenance teams start with simple tools to track and manage work orders, ...
28 Sep 2026
General managers are responsible for keeping operations productive, controlling costs, ...
22 Sep 2026
General managers are responsible for keeping operations productive, controlling costs, ...
22 Sep 2026
CMMS Checklist for Operations Managers: What to Evaluate Before You Buy Choosing the right ...
22 Sep 2026
Maintenance managers in manufacturing handle a demanding set of responsibilities: maintaining ...
22 Sep 2026