


Reena Sommer | 7 Jul 2026
Share this page:


Preventive Maintenance KPIs Every Facility Manager Should Track
Introduction
Tracking the right maintenance KPIs is the difference between a reactive firefighting culture and a proactive, cost-efficient operation. For facility managers, preventive maintenance metrics provide the hard data needed to justify budgets, demonstrate value to leadership, and keep critical assets running reliably. This guide walks you through the essential facility management KPIs—including MTTR, MTBF, PM compliance, downtime costs, and KPI dashboards—so you can build a measurement framework that drives real improvement.
Why Maintenance KPIs Matter?
Without data, maintenance is guesswork. Facility managers who rely solely on intuition often find themselves trapped in a reactive cycle: equipment fails unexpectedly, emergency repairs drain the budget, and productivity suffers as teams scramble to restore operations. Maintenance KPIs break that cycle by making performance visible and measurable.
Preventive maintenance metrics serve several critical functions in a well-run facility:
- Accountability: KPIs give maintenance teams clear targets and make performance transparent across the organization.
- Budget justification: Hard data on downtime costs and repair trends is far more persuasive than anecdotal evidence when requesting capital expenditures or additional headcount.
- Tracked over time, maintenance KPIs like MTBF and MTTR reveal whether your programs are improving, stagnating, or declining. Analyzing these trends helps facility managers identify patterns, prioritize interventions, and foster continuous improvement in asset reliability and maintenance efficiency.
- Benchmarking: Facility management KPIs let you compare your operation’s performance against industry standards and peer facilities.
- Risk reduction: Leading indicators, such as PM compliance rates, can signal asset risk before failures occur, enabling proactive intervention.
Research shows that organizations with mature preventive maintenance programs and strong KPI discipline outperform their peers in asset reliability and total maintenance cost. According to industry data, unplanned downtime costs industrial manufacturers an estimated $50 billion annually. These losses are no joke. Having reliable maintenance metrics can significantly reduce financial losses and should be implemented.
Choosing actionable KPIs helps facility managers feel confident that every metric you track will lead to meaningful decisions or behavior changes. The facility management KPIs covered in this article are designed to support that confidence.
Core Maintenance KPIs
|
KPI |
What It Measures |
Target Direction |
Review Frequency |
|
MTTR |
Average repair time |
Lower is better |
Monthly |
|
MTBF |
Reliability interval |
Higher is better |
Monthly / Quarterly |
|
PM Compliance |
Scheduled task completion rate |
Higher is better (≥95%) |
Weekly / Monthly |
|
Planned Maintenance % |
Proactive vs. reactive ratio |
Higher is better (>85%) |
Monthly |
|
Cost per Work Order |
Maintenance efficiency |
Lower is better |
Monthly |
|
Downtime Cost |
Financial impact of failures |
Lower is better |
Monthly |
|
OEE |
Overall Equipment Effectiveness |
Higher is better (>85%) |
Weekly |
Calculating MTTR and MTBF
Mean Time to Repair (MTTR) and Mean Time Between Failures (MTBF) are two common preventive maintenance metrics for facility managers. Together, they paint a complete picture of both your team’s responsiveness and your assets’ reliability.
Mean Time to Repair (MTTR)
MTTR measures the average time required to restore a failed asset to full operational condition. It encompasses everything from the moment a failure is reported to when the equipment is back online; including diagnosis, parts replacement, repair, and testing.
MTTR Formula: MTTR = Total Downtime ÷ Number of Failures
For example: If a production pump had broke down3 times last month, each with a total repair time of 9 hours, the MTTR is 3 hours.
A low MTTR indicates an efficient maintenance team with good parts availability, clear repair procedures, and effective diagnostic tools. Ways for reducing MTTR include:
- Stocking critical spare parts on-site or through vendor-managed inventory programs
- Developing and posting standard operating procedures (SOPs) for common repair tasks
- Having diagnostic tools that help technicians identify root causes faster
- Training technicians to reduce dependency on specialist availability
- Implementing mobile CMMS access so technicians can view asset history and instructions in the field
Mean Time Between Failures (MTBF)
MTBF measures the average time between failures for a repairable asset. It is the primary metric for evaluating equipment reliability.
MTBF Formula: MTBF = Total Operating Time ÷ Number of Failures
Here’s another example: A compressor that ran for 2,400 hours and experienced four failures has an MTBF of 600 hours. If your preventive maintenance program is working, MTBF should trend upward over time as asset health improves.
MTBF is valuable for:
- Setting PM intervals: If an asset’s MTBF is 600 hours, scheduling preventive inspections at 400–500-hour intervals provides a safety buffer before the next likely failure.
- Capital planning: Consistently declining MTBF on aging equipment signals that replacement may be more cost-effective than continued repair.
- Warranty and vendor negotiations: Documented MTBF data strengthens your position in service contract negotiations or warranty claims.
MTTR vs. MTBF: Using Both Together
MTTR and MTBF work together. High MTBF with low MTTR is the ideal combination—equipment fails rarely, and when it does, your team restores it quickly. Use the ratio of MTTR to MTBF to calculate availability:
Availability = MTBF ÷ (MTBF + MTTR)
For the compressor example above (MTBF = 600 hours, MTTR = 3 hours), availability = 600 ÷ (600 + 3) = 99.5%. This formula is the foundation of reliability-centered maintenance (RCM) programs and is often used to set asset-level availability targets in service-level agreements.
PM Compliance
PM compliance rate measures the percentage of scheduled preventive maintenance tasks that are completed on time. It is arguably the most directly controllable facility management KPI—unlike MTBF, which depends partly on asset age and manufacturing quality, PM compliance is almost entirely within your team’s control.
PM Compliance Formula: PM Compliance Rate = (PM Tasks Completed on Time ÷ PM Tasks Scheduled) × 100
Industry best practice targets a PM compliance rate of 90% or higher, with world-class operations achieving 95% or higher. Understanding these benchmarks helps facility managers set achievable goals and identify performance gaps. Consistently falling the 80% indicates issues that are unrealistic, such as unrealistic schedules, understaffing, or reactive work encroaching on planned tasks.
Why PM Compliance Drives All Other Metrics
PM compliance is a leading indicator. It predicts future performance on lagging indicators, such as MTBF and downtime costs, before those consequences materialize. When PM compliance drops:
- Assets miss lubrication, calibration, filter changes, and other small tasks that prevent larger failures
- MTBF shortens as equipment degrades faster than the PM program intended
- Reactive repair costs increase, consuming labor hours that should be spent on planned work
- A vicious cycle begins: reactive work displaces PMs, which generates more failures, which generates more reactive work
Common Causes of Low PM Compliance
Before you can improve PM compliance, you need to understand why it’s falling. The most common root causes include:
- Overloaded schedules: Too many PMs assigned relative to available labor hours
- Parts unavailability: Technicians arrive at the job and find the required parts are not in stock
- Poor work order management: PMs are scheduled but not properly dispatched or tracked
- Emergency priority conflicts: Breakdowns interrupt planned work without compensating for schedule adjustments
- Inadequate documentation: Technicians lack clear instructions and spend excessive time on each task
Strategies to Improve PM Compliance
- Audit your PM schedule: Review each task for realistic time estimates, and eliminate or defer PMs with low failure-prevention value.
- Use a CMMS: Computerized maintenance management systems automate PM scheduling, dispatch, and compliance tracking, removing the administrative burden from supervisors.
- Implement a PM backlog process: When PMs slip, have a defined protocol for rescheduling rather than simply dropping them.
- Separate reactive and planned work queues: Protect PM time by designating some technicians for planned work only during certain shifts
- Track and report weekly: Monthly reporting catches problems too late; weekly PM compliance reviews allow timely course correction
Downtime Costs
Downtime cost is one of the most powerful maintenance KPIs for gaining leadership attention and securing maintenance investment. Expressed in dollars, it translates abstract technical performance into the language of business impact.
Components of Downtime Cost
Calculating true downtime cost requires capturing multiple cost streams:
- Lost production: Revenue or throughput not generated during the downtime period. For a production line generating $10,000/hour, a 4-hour failure costs $40,000 in lost output.
- Labor inefficiency: Workers idled or redeployed due to equipment failure still draw wages.
- Emergency repair premiums: Unplanned repairs typically cost 3–5× as much as the same work planned, due to overtime labor, expedited parts shipping, and contractor premiums.
- Quality losses: Product scrapped or reworked due to equipment running outside specification during or after a failure.
- Safety and environmental costs: Incidents arising from unexpected failures can entail regulatory, legal, and reputational costs.
- Customer impact: Late deliveries, SLA penalties, and damage to customer relationships from production shortfalls.
Downtime Cost Formula: Total Downtime Cost = (Lost Revenue per Hour × Hours Down) + Emergency Labor Premium + Parts Premium + Quality Losses + Other Costs
Using Downtime Costs to Prioritize PM Investment
Not all downtime is equal. A 2-hour failure on a non-critical HVAC unit is not equivalent to a 2-hour failure on a production bottleneck. Downtime cost data lets you rank assets by their failure impact and prioritize PM investment accordingly.
A simple asset criticality framework based on downtime cost:
|
Criticality Tier |
Downtime Cost |
PM Strategy |
MTBF Target |
|
Tier 1 (Critical) |
>$10,000/hour |
Predictive + Preventive |
>2,000 hours |
|
Tier 2 (Important) |
$1,000–$10,000/hour |
Preventive + Inspection |
>1,000 hours |
|
Tier 3 (Standard) |
$100–$1,000/hour |
Preventive + Condition-based |
>500 hours |
|
Tier 4 (Non-critical) |
<$100/hour |
Run-to-failure acceptable |
Baseline |
This tiered approach ensures that your most resource-intensive PM activities are focused on the assets where failure has the greatest financial consequence—a principle central to reliability-centered maintenance.
KPI Dashboards
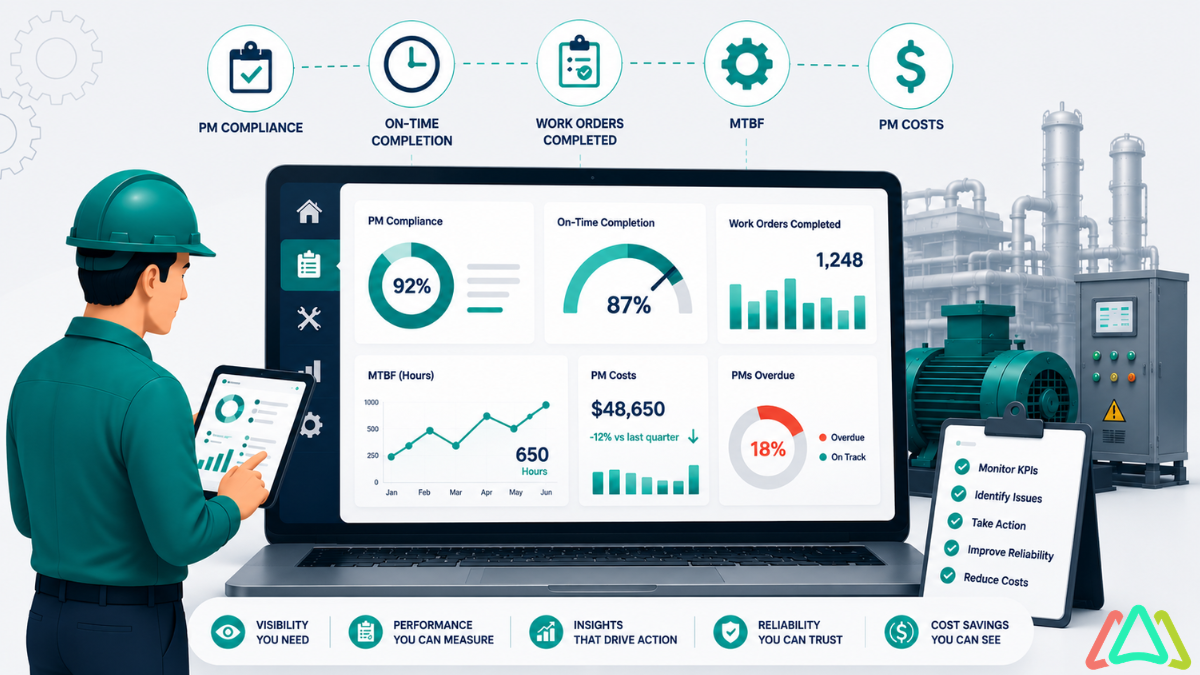
Individual maintenance KPIs are useful, but a well-designed KPI dashboard is what makes them actionable across the organization. Dashboards surface the metrics that matter, make trends visible at a glance, and enable different audiences—from frontline technicians to the CFO—to engage with maintenance performance data in the context they need.
Dashboard Design Principles
Effective facility management KPI dashboards share several characteristics:
- Audience-specific views: Technicians need work order queues and PM due dates. Supervisors need compliance rates and backlog trends. Executives need downtime cost summaries and reliability trends. One dashboard rarely serves all three audiences well.
- Leading and lagging indicators: Lagging indicators (MTTR, MTBF, downtime costs) tell you what happened. Leading indicators (PM compliance rate, open PM backlog) tell you what is about to happen. Good dashboards include both.
- Trend visibility: A single data point has limited meaning. KPI dashboards should display metrics over time—rolling 12-month trends, month-over-month comparisons, and year-over-year benchmarks.
- Exception alerting: Rather than requiring managers to scan every metric, dashboards should highlight KPIs that have crossed a threshold or are trending in the wrong direction.
- Data integrity: Dashboard data is only as trustworthy as the work order data feeding it. Consistent technician documentation practices are a prerequisite for meaningful dashboard reporting.
Recommended Dashboard Metrics by Audience
|
Audience |
Primary KPIs |
Review Frequency |
Key Action Trigger |
|
Technician |
Open work orders, PM due today/overdue, MTTR by job |
Daily |
Overdue PMs > 5 |
|
Supervisor |
PM compliance %, backlog hours, reactive vs. planned ratio |
Weekly |
Compliance < 90% |
|
Manager |
MTTR, MTBF trends, cost per work order, downtime cost |
Monthly |
MTBF declining 3+ months |
|
Executive |
Total maintenance cost, OEE, downtime cost, and capex triggers |
Monthly / Quarterly |
Downtime cost > budget |
CMMS and Maintenance Software Integration
Modern computerized maintenance management systems (CMMS) automatically generate the data that populates KPI dashboards. Leading platforms, including IBM Maximo, UpKeep, Fiix, Limble CMMS, and Hippo CMMS, offer built-in reporting dashboards that track preventive maintenance metrics in real time.
When evaluating CMMS software for KPI reporting, prioritize:
- Pre-built reports for MTTR, MTBF, PM compliance, and work order cost
- Configurable dashboards that different users can personalize
- Export and integration capabilities for ERP or BI tools like Power BI or Tableau
- Mobile access so technicians can close work orders in the field, keeping data current
- API connectivity for organizations that want to consolidate maintenance data with operational data from production, quality, or financial systems
FAQ
What are the most important maintenance KPIs for a facility manager?
The most critical facility management KPIs are MTTR (responsiveness), MTBF (reliability), PM compliance rate (program health), planned maintenance percentage (proactive vs. reactive balance), and downtime cost (business impact). Start with these five before adding more complex metrics.
What is a good MTTR target?
MTTR targets vary significantly by asset type and industry. For critical production equipment, many organizations target MTTR under 2–4 hours. For less critical assets, 8–24 hours may be acceptable. The most meaningful comparison is your own historical trend—is MTTR improving over time?
What is a good MTBF for manufacturing equipment?
MTBF targets depend on asset age, complexity, and criticality. For critical equipment, many manufacturers target MTBF above 1,000–2,000 hours. The key is establishing a baseline and tracking whether your preventive maintenance program is extending it over time.
What is PM compliance rate, and why does it matter?
PM compliance rate is the percentage of scheduled preventive maintenance tasks completed on time. It matters because it’s a leading indicator—it predicts future reliability and downtime before problems occur. A falling PM compliance rate is an early warning that asset failures are likely to increase in the coming months.
How do you calculate downtime cost?
Multiply your hourly production loss rate by downtime hours, then add emergency labor premiums, expedited parts costs, quality losses, and any other associated costs. For many facilities, the most important input is the hourly revenue or throughput impact, which makes the business case for preventive maintenance investment concrete and compelling.
What CMMS should I use for maintenance KPI tracking?
The right CMMS depends on your facility size, budget, and technical infrastructure. Widely used options include UpKeep and Limble CMMS for smaller or mid-size operations, and IBM Maximo or SAP PM for large enterprise environments. Evaluate any platform on the quality of its built-in preventive maintenance metrics reporting before committing.
How often should I review maintenance KPIs?
PM compliance and open work order backlogs should be reviewed weekly—problems compound quickly, and monthly reviews catch issues too late to prevent cascading failures. MTTR, MTBF, and downtime costs are typically reviewed monthly. Strategic KPIs like total maintenance cost as a percentage of asset replacement value are appropriate for quarterly or annual review.
What is planned maintenance percentage (PMP)?
PMP measures the proportion of total maintenance labor hours spent on planned work (preventive, predictive, and scheduled corrective) versus reactive or emergency repairs. World-class operations achieve PMP above 85%. Low PMP indicates that reactive work is dominating the maintenance program, which typically correlates with higher costs and lower asset reliability.
Implementing a Maintenance KPI Program
The facility managers who get the most from their maintenance KPI programs share a common approach: they start simple, focus on consistency, and tie every metric back to a decision. You do not need to track twenty KPIs from day one. Pick the three or four that matter most for your current challenges—whether that’s reducing reactive work, improving PM compliance, or making the case for capital investment—and track them relentlessly.
As your program matures, add metrics that reveal new dimensions of performance. Build dashboards that make data visible to the people who can act on it. And revisit your KPIs annually to ensure they still reflect your facility’s most important improvement priorities.
Preventive maintenance metrics are not an end in themselves—they are a management tool. Used well, they are among the most powerful levers a facility manager has to improve reliability, control costs, and demonstrate the strategic value of a world-class maintenance program.
TABLE OF CONTENTS





Keep Reading
Keeping accurate records of equipment maintenance is essential for any organization that ...
5 Oct 2026
Small businesses start managing equipment maintenance with whatever tools are already ...
5 Oct 2026
A maintenance technician is ready to repair a critical piece of equipment, but the ...
2 Oct 2026
Assigning the right work order to the right maintenance technician sounds simple. A ...
2 Oct 2026
A broken door handle gets reported by email. An employee texts a technician about a leaking ...
1 Oct 2026
Even for small maintenance teams, investing in CMMS software is worthwhile when manual ...
1 Oct 2026
Managing a maintenance budget is one of the most important responsibilities for maintenance ...
1 Oct 2026
Managing maintenance across a single school or school district becomes complicated as the ...
29 Sep 2026
Executive Directors are responsible for much more than day-to-day operations. They oversee ...
29 Sep 2026
Managing a maintenance budget is one of the most important responsibilities for maintenance ...
29 Sep 2026
Maintenance Directors should look for CMMS software that makes it easier to manage work ...
28 Sep 2026
Facility maintenance software can help Maintenance Managers control costs by improving ...
28 Sep 2026
Facility management software improves preventive maintenance by helping Maintenance Managers ...
28 Sep 2026
When a classroom door will not close, an HVAC unit stops working, or a sink begins leaking, ...
28 Sep 2026
Many facility maintenance teams start with simple tools to track and manage work orders, ...
28 Sep 2026
General managers are responsible for keeping operations productive, controlling costs, ...
22 Sep 2026
General managers are responsible for keeping operations productive, controlling costs, ...
22 Sep 2026
CMMS Checklist for Operations Managers: What to Evaluate Before You Buy Choosing the right ...
22 Sep 2026
Maintenance managers in manufacturing handle a demanding set of responsibilities: maintaining ...
22 Sep 2026
Managing maintenance across a school, college, university, or multi-building campus quickly ...
21 Sep 2026