
Reena Sommer | 12 Dec 2025


Every maintenance team eventually faces the same question: When should we repair, and when should we replace? It’s one of the most critical decisions in asset management, and one of the easiest to get wrong. Replace too soon, and you waste money on assets that still have useful life. Replace too late, and you invite escalating repair costs, safety risks, and unplanned downtime.
The solution lies in understanding a simple but powerful reliability model: The Maintenance Bathtub Curve.
The bathtub curve shows the failure rate over time, providing a data-driven way to anticipate problems before they occur. By interpreting where an asset sits on this curve, maintenance teams can predict future performance, optimize maintenance schedules, and make confident repair-or-replace decisions.
In this article, we explore how the bathtub curve works, what each phase means for maintenance strategy, and how to apply it to make smarter, evidence-based decisions that extend asset life, reduce downtime, and control costs.
What Is the Maintenance Bathtub Curve?
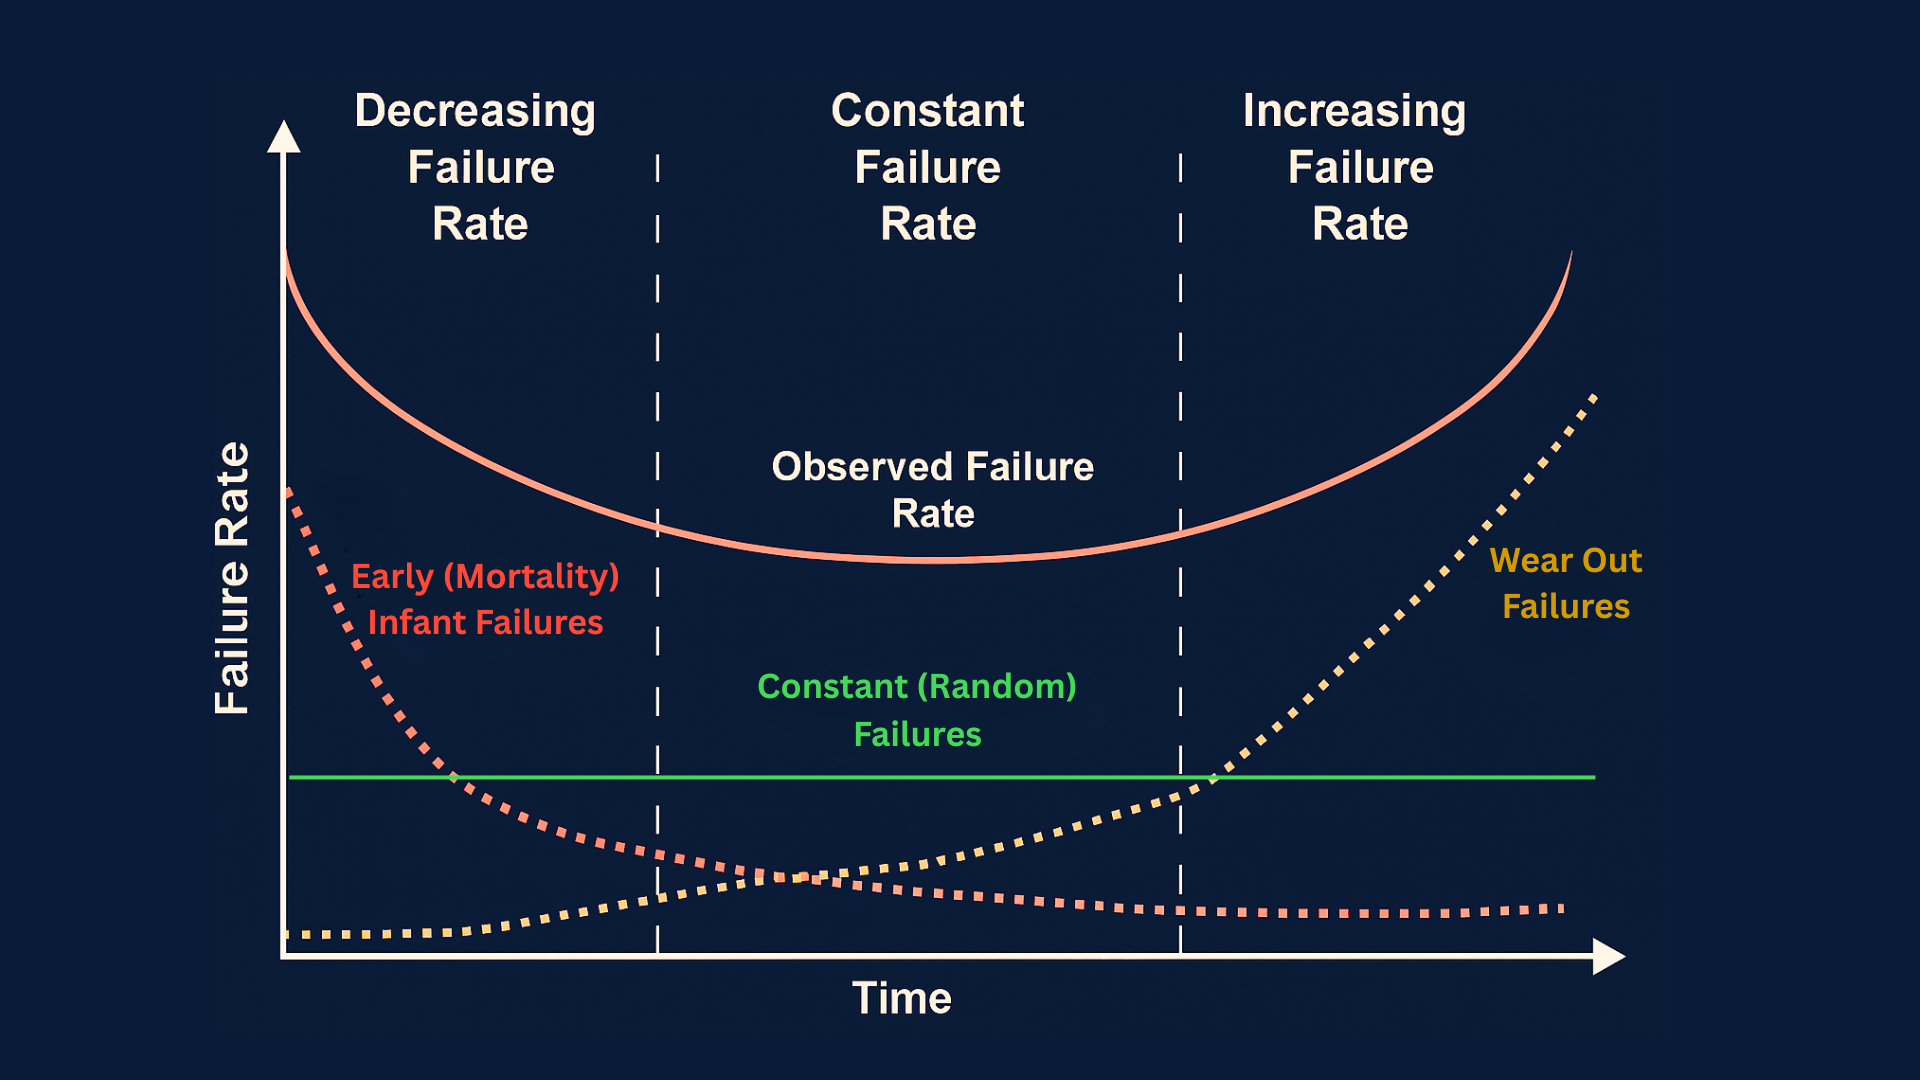
The Maintenance Bathtub Curve is a graphical model that illustrates how equipment failure rates change over time. From Figure 1, the vertical axis shows the failure rate, and the horizontal axis shows the asset's age or operational time. When plotted, the curve resembles a bathtub, rising high, flattening in the middle, and rising again toward the end. This shape represents three distinct phases of an asset’s life: early failure, normal operation, and wear-out.
Core Assumptions and Limitations
While highly useful, the bathtub curve is a conceptual model, not a universal law. Real-world data may show deviations from the classic curve. Some assets exhibit no early “infant mortality” phase, while others may experience several smaller curves after major repairs or overhauls. To use the bathtub curve effectively, maintenance teams must calibrate it with asset-specific, time-series data.
In essence, the Maintenance Bathtub Curve provides a foundation for understanding equipment behavior, enabling data-driven maintenance and replacement decisions that extend asset reliability and reduce lifecycle costs.
The Three Phases of the Bathtub Curve
Phase 1: Infant Mortality or Early Failures
First period of the Maintenance Bathtub Curve: High initial failure rate that decreases over time. These early failures are largely attributed to manufacturing defects, installation errors, or marginal components. During this phase, facility managers address this risk through burn-in testing, additional inspections, and rigorous monitoring to catch issues before full operation begins.

Phase 2: Normal Life or Random Failures
The second stage is when an asset is at its most stable and dependable, with a low, steady failure rate. Failures are typically random, caused by wear, environmental stress, or human error. The focus should be on preventive and predictive maintenance, supported by condition monitoring. Tracking Mean Time Between Failures (MTBF) and maintenance cost per hour helps maintain performance and control expenses.
Phase 3: Wear-Out or End-of-Life Failures
Finally, components experience an increasing failure rate as they age and/or deteriorate. Fatigue, corrosion, and obsolescence increase failure rates and costs during this period. Indicators include sudden spikes in failures or a decline in efficiency. Maintenance becomes more of an inspection process, a cost/benefit analysis correlated to the need-to-have rather than the nice-to-have drop in reliability.
How the Bathtub Curve Informs Repair vs Replace Decisions
The Maintenance Bathtub Curve provides a practical framework for deciding whether to repair or replace equipment. Maintenance teams can act based on an asset’s reliability and cost-effectiveness by knowing its current phase.
Mapping Assets to a Phase
Determining a machine’s phase involves reviewing its age, failure history, and performance trends. Tools such as historical failure logs, trend analysis, condition monitoring, and diagnostic reports help reveal whether the asset is in the early, stable, or wear-out stage of its lifecycle.
Phase-Based Guidelines
- In Phase 1 (infant mortality), repair is usually best unless the defect is systemic.
- In Phase 2 (everyday life), repairs remain optimal as long as maintenance costs are proportional to performance.
- In Phase 3 (wear-out), replacement becomes more cost-effective as failure frequency rises.
Key Decision Factors
Several criteria guide the repair-or-replace decision: total repair versus replacement costs (including parts, labor, and downtime), Remaining Useful Life (RUL), risk and criticality, spare part availability, and production impact.
In reliability engineering, risk is often expressed as:
RISK =Probability of Failure×Consequence
This simple relationship captures both the likelihood of failure and the severity of its consequences, either in financial losses, safety hazards, or downtime.
For example, reliability studies may show a 70% probability of component failure after 900 days, or predict two failures over a 1,500-day interval. Such insights inform spare parts planning, budget forecasts, and maintenance timing. When the probability of failure and associated costs both rise sharply, the data often reveal that replacement is more economical and reliable than continued repair.
Transition Triggers and Analysis
Specific signals, such as rising repair frequency or reduced reliability, indicate it is time to plan replacement. Financial models like Net Present Value (NPV), Total Cost of Ownership (TCO), and Payback Time support objective decision-making.
Implementing Bathtub-Curve Maintenance Strategy
1. Audit and Data Gathering
Inventory all assets while also gathering relevant information, including age, failure history, downtime records, and maintenance costs. Assess the quality of the relevant information gathered.
2. Classification and Grouping
Group assets into logical categories, such as pumps, motors, and compressors. Depending on the volume of work, the groups could be broad at this stage. Based on the available data as well as experience, place each asset or more likely asset class into a preliminary lifecycle phase.
3. Curve Fitting and Modeling
Plot failure rates over time for each group and apply statistical models like Weibull or hazard analysis to identify the shape of the curve. Estimate the start and end points of each lifecycle phase: infant mortality, regular operation, and wear-out.
4. Define Decision Rules and Thresholds
Establish clear metrics for when to shift from repair to replacement. For example, begin replacement planning when repair costs exceed a certain percentage of replacement cost.
5. Maintenance Plan by Phase
Early-life assets need close monitoring and testing. Mid-life assets benefit from preventive and predictive maintenance. Late-life assets require more frequent inspections and cost-benefit analyses for replacement or decommissioning.
6. Monitoring and Continuous Improvement
Regularly update failure data, reassess phase boundaries, and refine thresholds based on real performance.

7. Integration with Asset Management
Align bathtub curve insights with budgeting, procurement, and long-term capital planning to ensure maintenance decisions support overall business goals.
Benefits, Challenges, and Limitations
Key Benefits
As a result, applying the bathtub curve enables better data-driven maintenance decisions. By analyzing patterns of failure, companies can prevent unplanned downtime and implement timely interventions. Better allocation of funds ensures that maintenance spending is optimal and that all operating budgets and capital investments are adequately balanced. Furthermore, companies gain additional visibility into the optimal timing for long-term replacement, enhancing asset reliability and utilization and improving overall return on investment.
Challenges
The result is highly dependent on high-quality data. Uncertain or defective records may misshape the bend fitting and result in unreliable phase limitations. The staff may also resist adjustments to familiar maintenance routines. Unexpected external events, such as power surges or environmental conditions, can further disrupt predictions. There may also be a barrier due to the cost of implementing the statistics tools and sensors. Another potential source of error is overconfidence in the model's exactness without expert validation.
Limitations
The model is not well-suited to small, mostly simple assets that fail with complete randomness, or to systems that are especially sensitive to unexpected external shocks. The method is also not suitable for equipment, given rapidly evolving technologies and assets that are frequently subject to modernization.
Best Practices
Combine curve insights with engineering expertise. Apply safety margins, regularly refine models as new data becomes available, and promote collaboration across maintenance, engineering, and finance teams.
Practical Tips, Tools, and Techniques
Consider using tools such as Weibull analysis, hazard modeling, and predictive analytics to identify failure trends and optimize decision-making. Use dashboards to visualize asset phases and trigger alerts as reliability shifts. Integrate these insights with Root Cause Analysis and cross-team collaboration, because everyone’s expertise matters in reliability.
Templates and Checklists
Develop a “phase assignment worksheet” for classifying assets and a decision rule template to guide repair-versus-replace actions. Maintain a phase-specific monitoring checklist that defines what metrics to track and how often.
Pilot Testing
Begin with a small group of critical assets to validate assumptions, calibrate models, and demonstrate ROI. Use insights from the pilot before expanding enterprise-wide.
Cross-Team Collaboration
Encourage them to work together on assets, their health, and replacements with operations, engineering, finance, and procurement for sustainable results.
Further Considerations & Variations
The traditional bathtub curve does not apply to all assets. For instance, some electronic bathtubs may exhibit a pattern of “infant mortality only” due to early works. The pattern may continue even when there is “no infant mortality” at all, as a result of employing well-tested units. Even after new parts are installed, the bathtub shape can often be remanufactured many times, leading to renewed early failures. Also, in complex systems, hybrid or composite bath curves emerge. This occurs when two or three units combine to form subsystems and use separate lifecycles to hide component behavior.
Maintenance teams can tailor the curve by analyzing historical data and fitting models for each asset class using Weibull or survival analysis.
Deciding When to Repair or Replace
The bathtub curve of maintenance provides a conceptual representation of how asset failures evolve over their life cycle. There are three distinct phases; understanding these stages helps maintenance teams determine when equipment should be repaired or replaced. At the same time, it is crucial to understand that the curve is not a strict rule but a conceptual frame for decision-making.
The bathtub curve is more than a visual model; it’s a way of thinking that informs us how an asset behaves over its lifetime, allowing us to anticipate, not just react.”
In practice, this means repairing equipment while it remains in a predictable, cost-effective phase of its life cycle, and replacing it once failures become frequent, costly, or unsafe. By understanding where each asset sits on the curve, maintenance teams can shift from reactive fixes to proactive, data-driven lifecycle management.
To apply it effectively, begin with a small pilot project. Choose a few assets, gather historical failure data, and plot their performance over time. Use this information to identify trends, define maintenance thresholds, and refine your strategy through continuous learning.
Next, involve management and finance teams to ensure maintenance insights align with operational and investment goals.
Maintenance improvement thrives on collaboration. Share your findings, learn from others, and keep refining your approach to build a culture of reliability and data-driven asset management.
TABLE OF CONTENTS